Intellect is a personal observability dashboard I built to instrument and experiment my own life. It pulls my sleep, work, workouts, spending, location, time with people, and my daily journals into one place, and turns years of passively-collected data into something I can actually read at a glance. Almost nothing is logged by hand, and it takes less than five minutes a day to keep up-to-date.
My long-horizon goal is to enable and provide long-context agents with enough data about me to isolate and identify repetitive patterns and trends, upturns and downturns, and isolate confounding variables to better discover myself.
How it works
This has been a developing project for a year, with data from over eight years ago. At the center of the whole system is a single Google Sheet that acts as my database (largely since I started entirely with sheets and formulas, making it much more modular and extensible than if I began with a database and website), with one tab per domain: Sleep, Screen, Money, Time, Workouts, Hangouts, and more. A set of Google Apps Script jobs feed those tabs on time-based triggers, each owning one source.
- Everything normalizes onto a shared set of conventions. Durations are stored as fractions of a day, so Sheets formats them as native times. A 3 AM "logical day" boundary means a 1 AM workout or a late coding session rolls up to the right date instead of splitting across two.
- Every job is idempotent: it keys off transaction and calendar-event IDs kept in a dedicated column per tab, so re-runs never double-count.
- Work, sleep, hangouts, and workouts also sync their rows to/from a matching Google Calendar, which doubles as a human-readable backup and an editing surface.
The dashboard itself is a Next.js app that reads those tabs through a Google service account, fetching each one in parallel and caching hourly, then parsing the rows into typed series for charts built on Recharts and Chart.js.
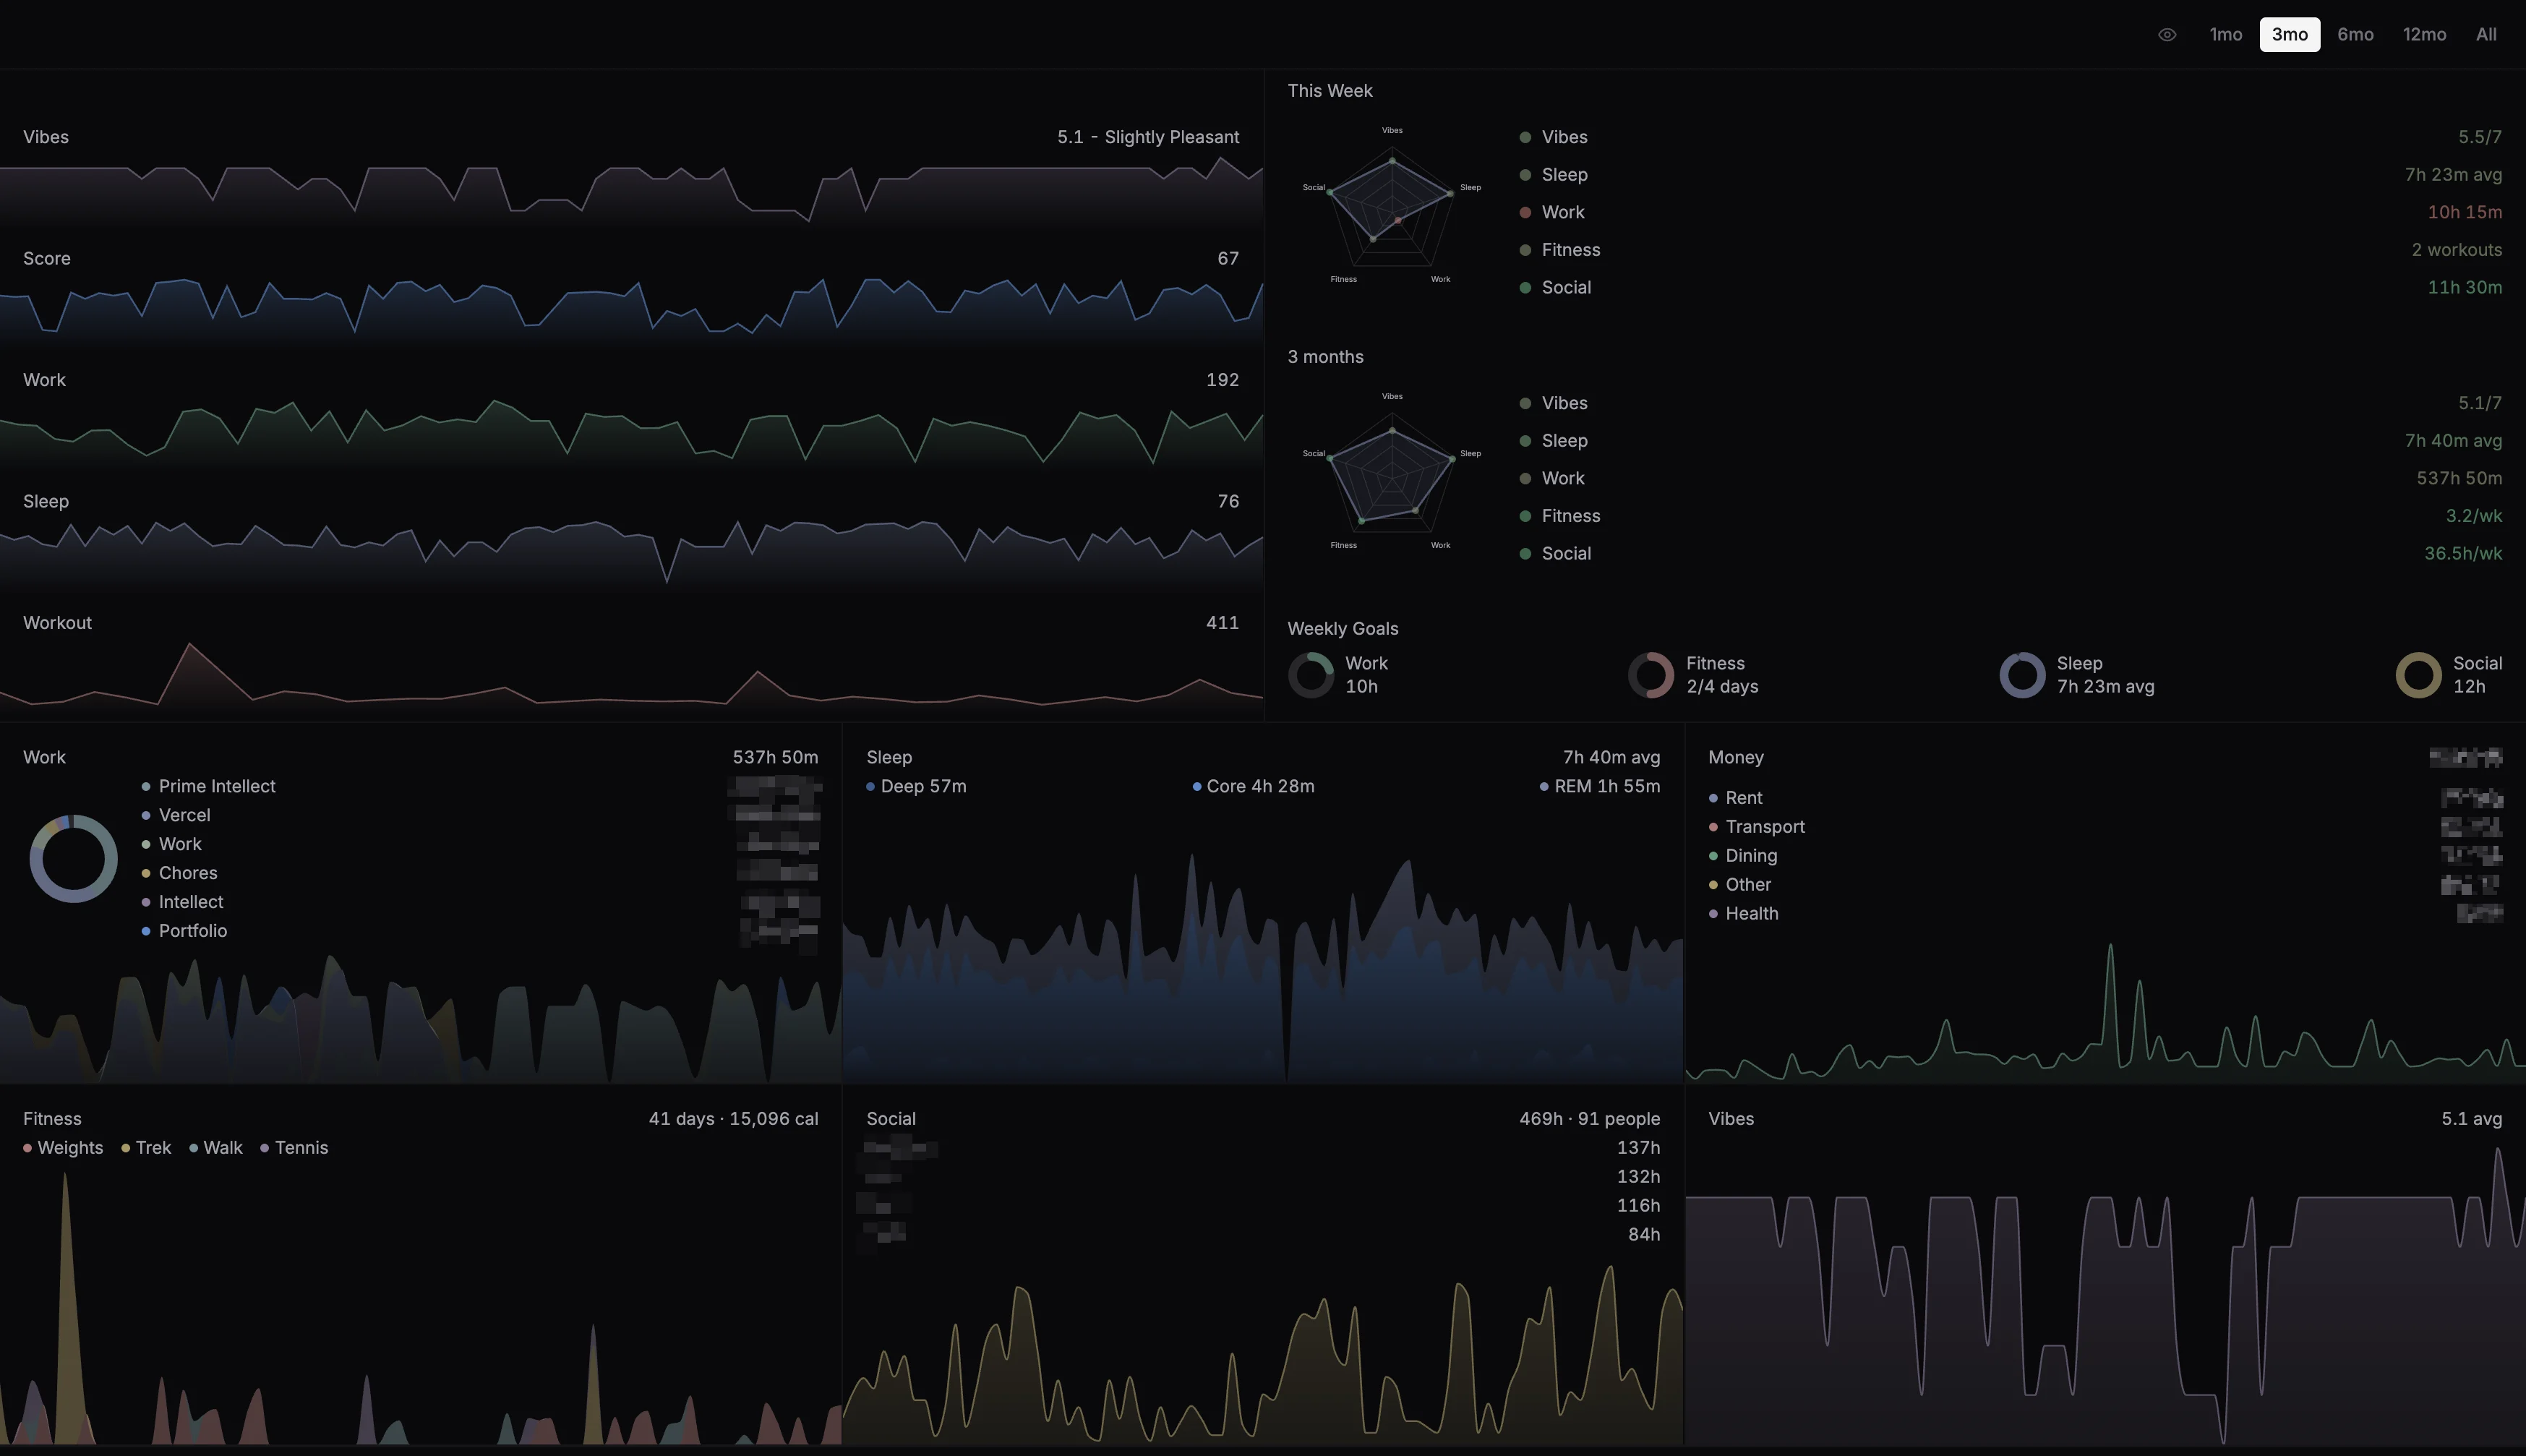
Overview
On the top of the dashboard is the at-a-glance view. Sparklines for the things I care about most: vibes (self-declared happiness index for each day), work, sleep, and workouts. On the right, two radar charts score me across five axes (vibes, sleep, work, fitness, social) for this week, compared to my selected time period and normalized against my own targets.
Work
Work is tracked in a time sheet that syncs bidirectionally from my Google Calendar, allowing me to block out sessions when I work. Most of my historical backtracking was via Wakatime and Google Calendar events.
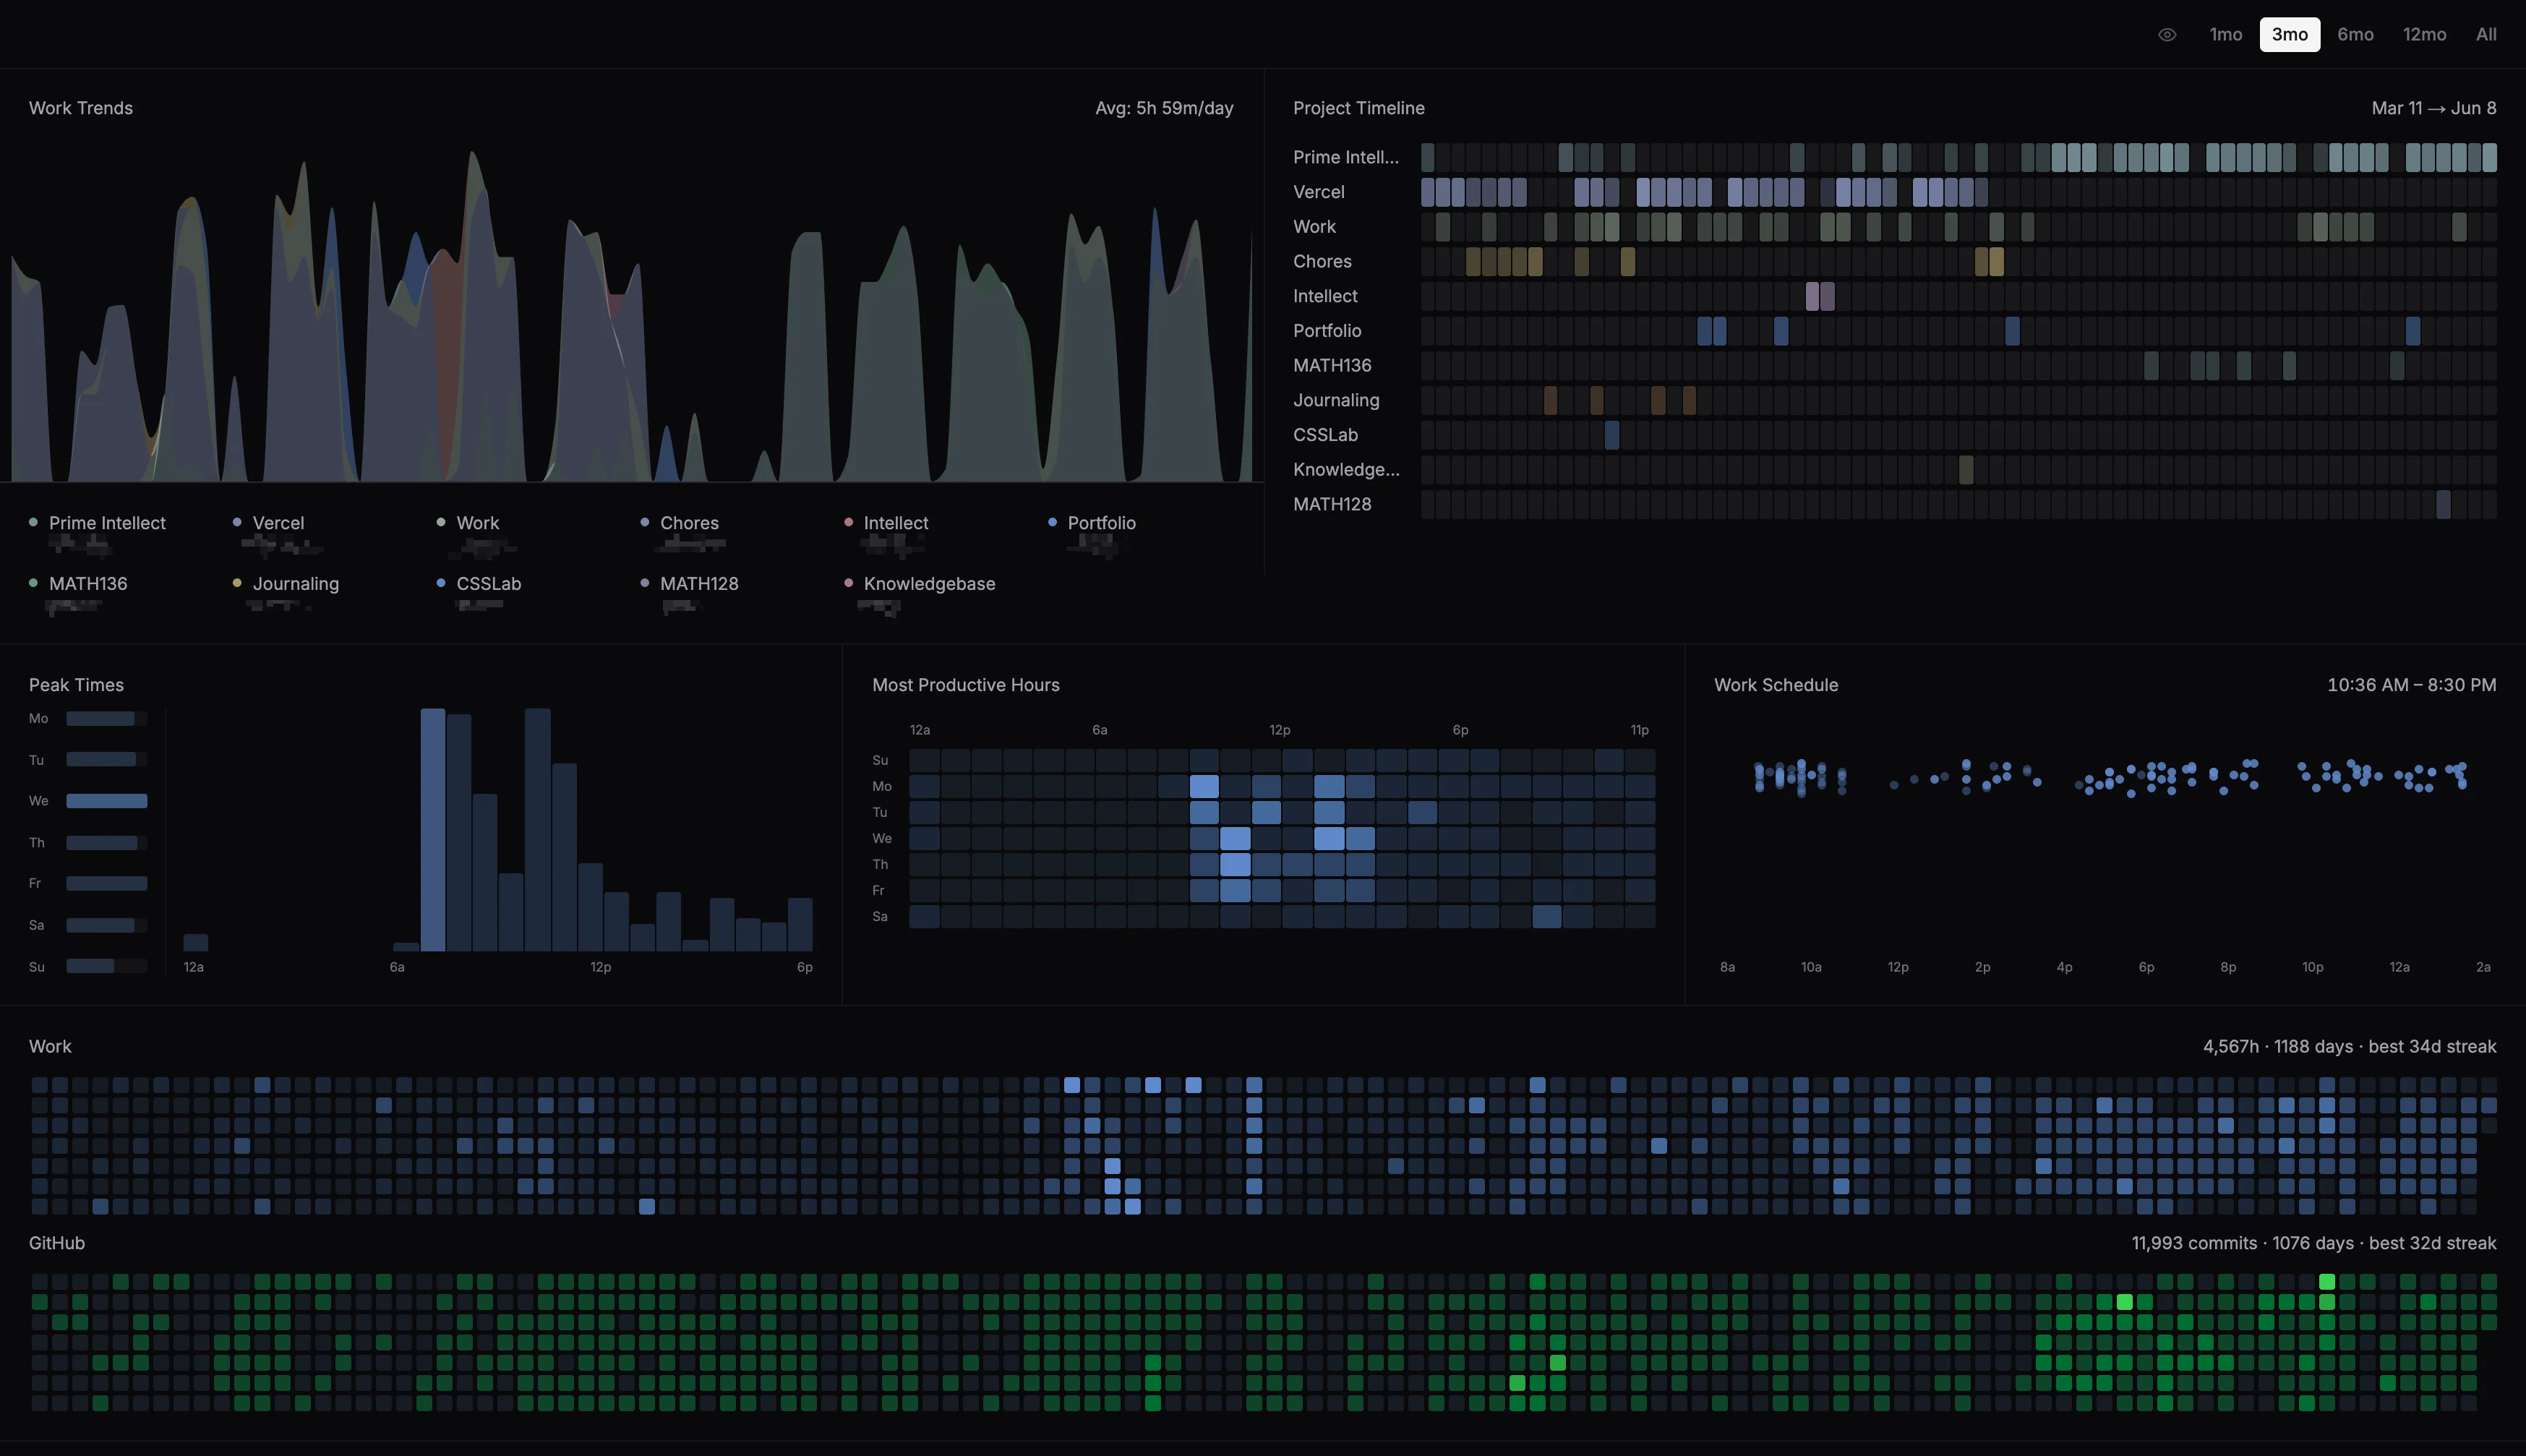
Work sessions break down by project, allowing me to see exactly where I invest my time; and the project timeline lays every day out as a per-project heatmap. The lower charts surface patterns I can't feel day to day: which hours I'm actually productive and my typical work window. At the bottom, two all-time heatmaps track every logged session and every GitHub contribution.
While the dashboard looks great, most of my insight is gained from letting Codex run free and learn from my data.
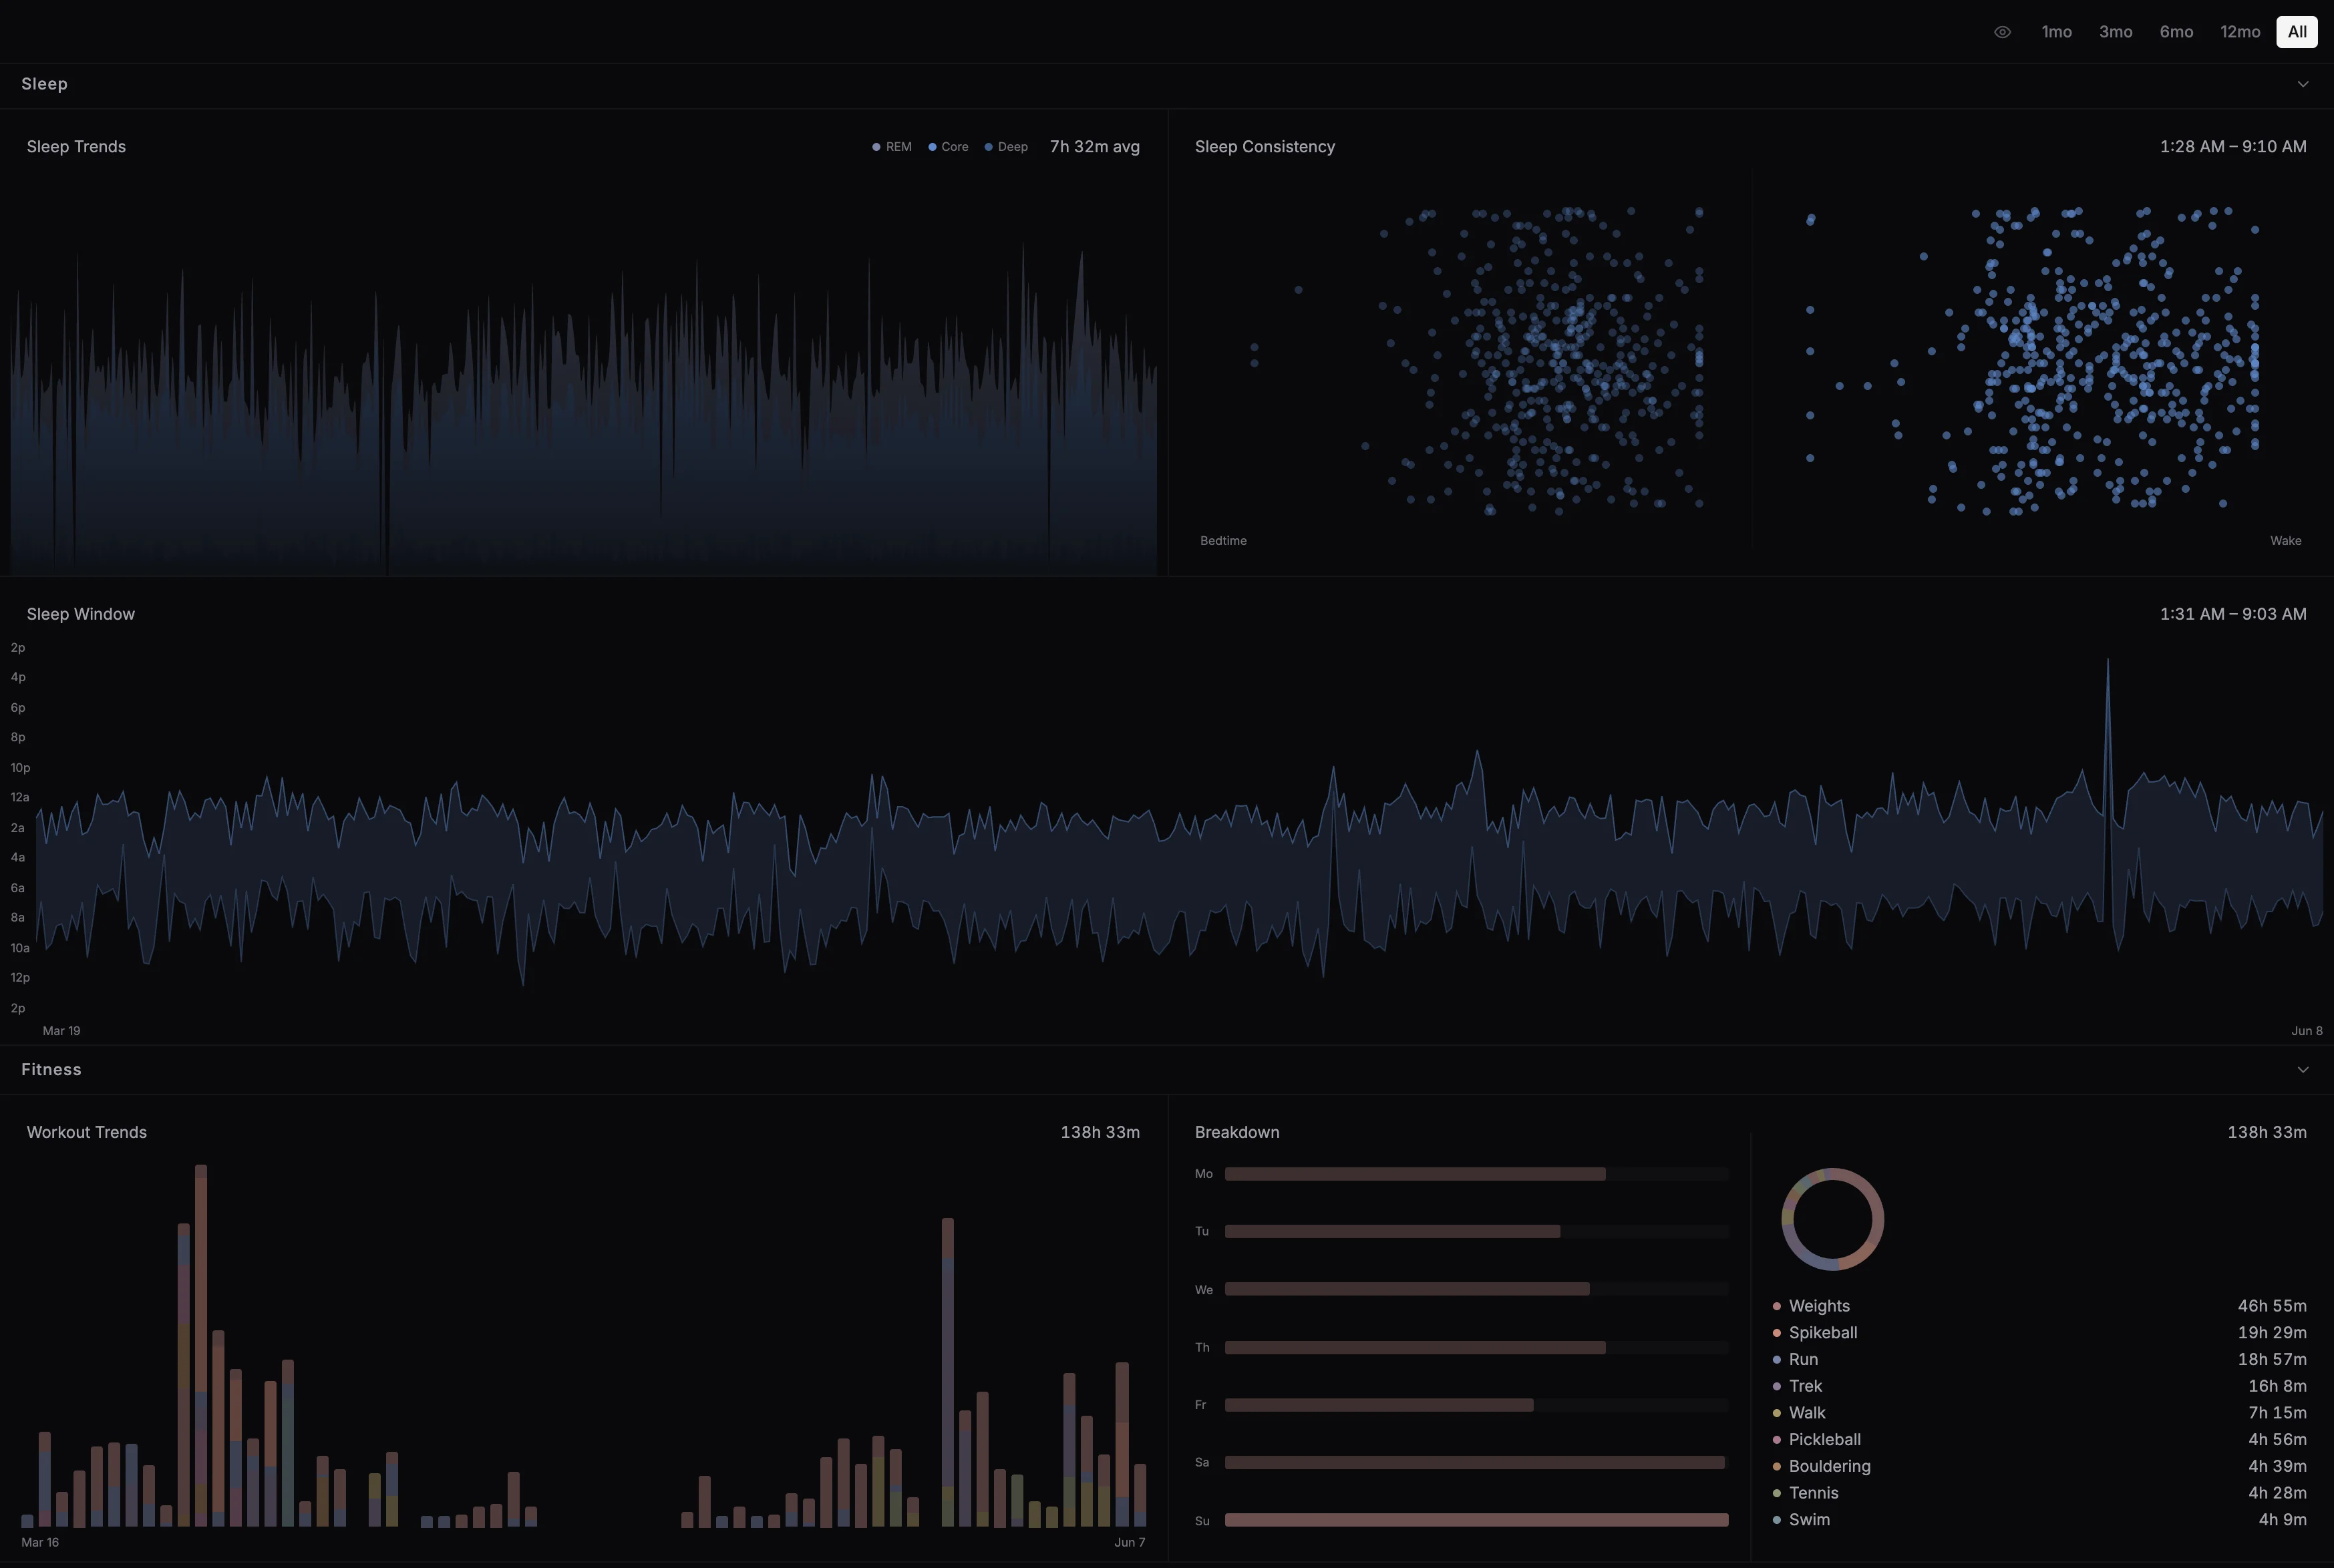
Sleep & Fitness
Sleep is sent directly from my Apple Watch to a Google Sheet webhook every morning, tracking REM, core, and deep durations into my Sleep sheet. Alongside this, a sleep-score formula weighs total hours, bedtime, wake time, and stage ratios to provide an overarching summary of my sleep. Workouts mostly sync from Strava: a trigger regularly pulls each activity's details (distance, heart rate, calories), maps Strava's sport types to my own categories, computes pace, and writes it all to the Workouts sheet, deduplicating by activity ID and mirroring to a Workouts calendar.
Money
Money is the most involved collector. It scans my email for transaction emails across my Canadian and American bank accounts, regexes the merchant and amount out of each one, then runs the raw merchant string through a tiny model classifier via Vercel AI gateway. This allows me to automatically tag and bucket every transaction into categories. All transactions are reconciled to CAD and USD, and recurring fixed costs like rent are spread evenly across the month so my trend charts remain interpretable.
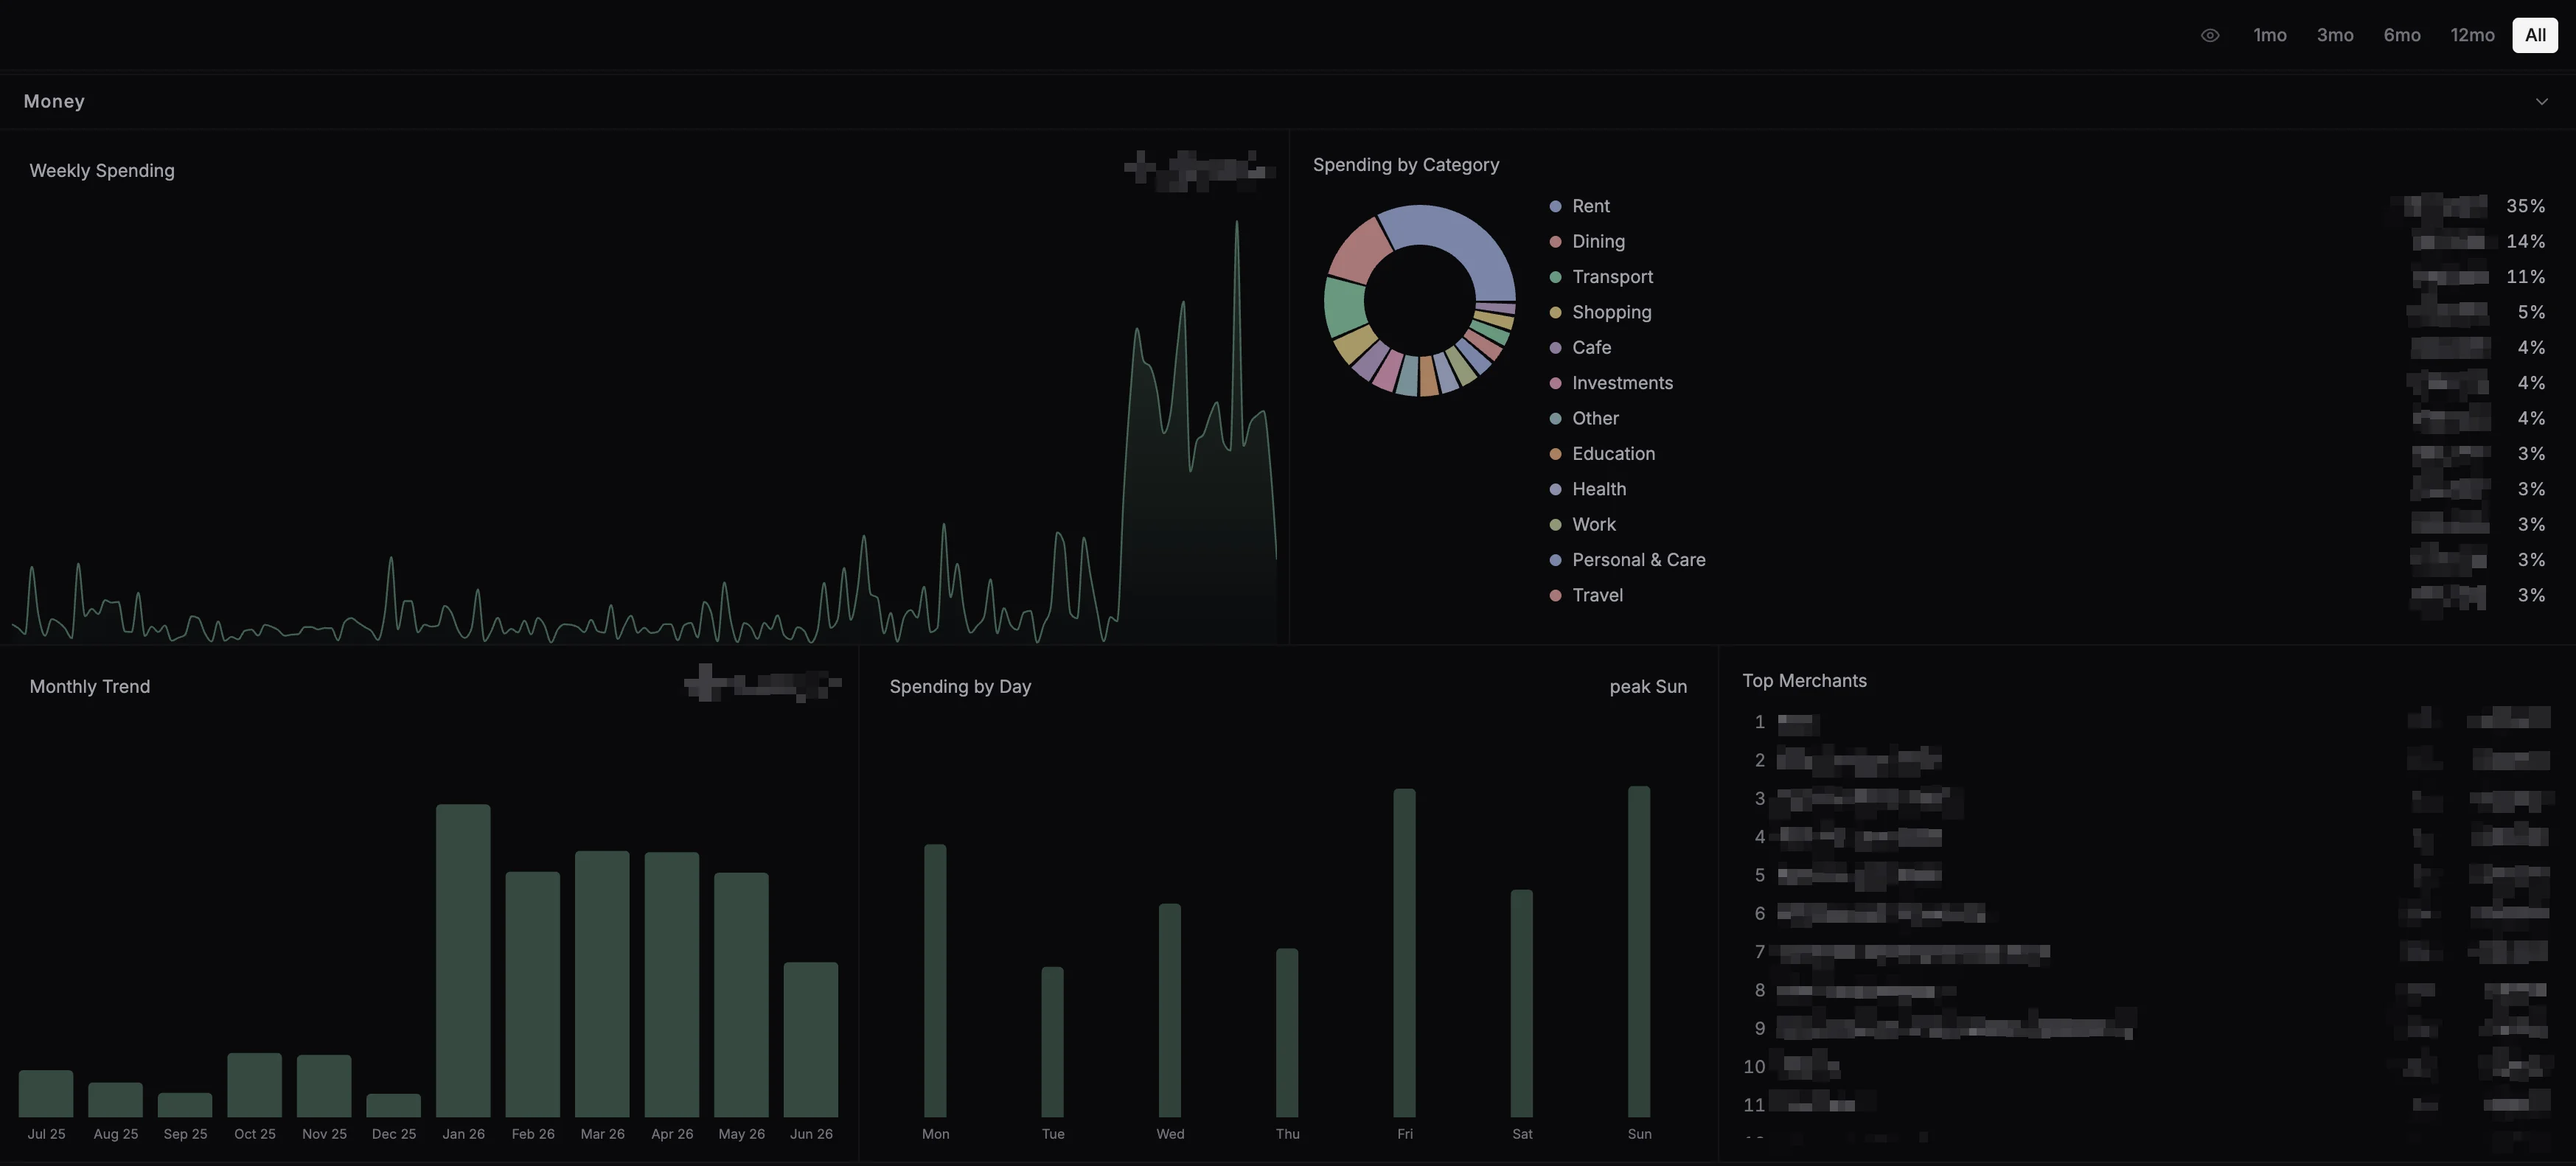
Notice the immense increase in spending when I moved to San Francisco and had to pay rent
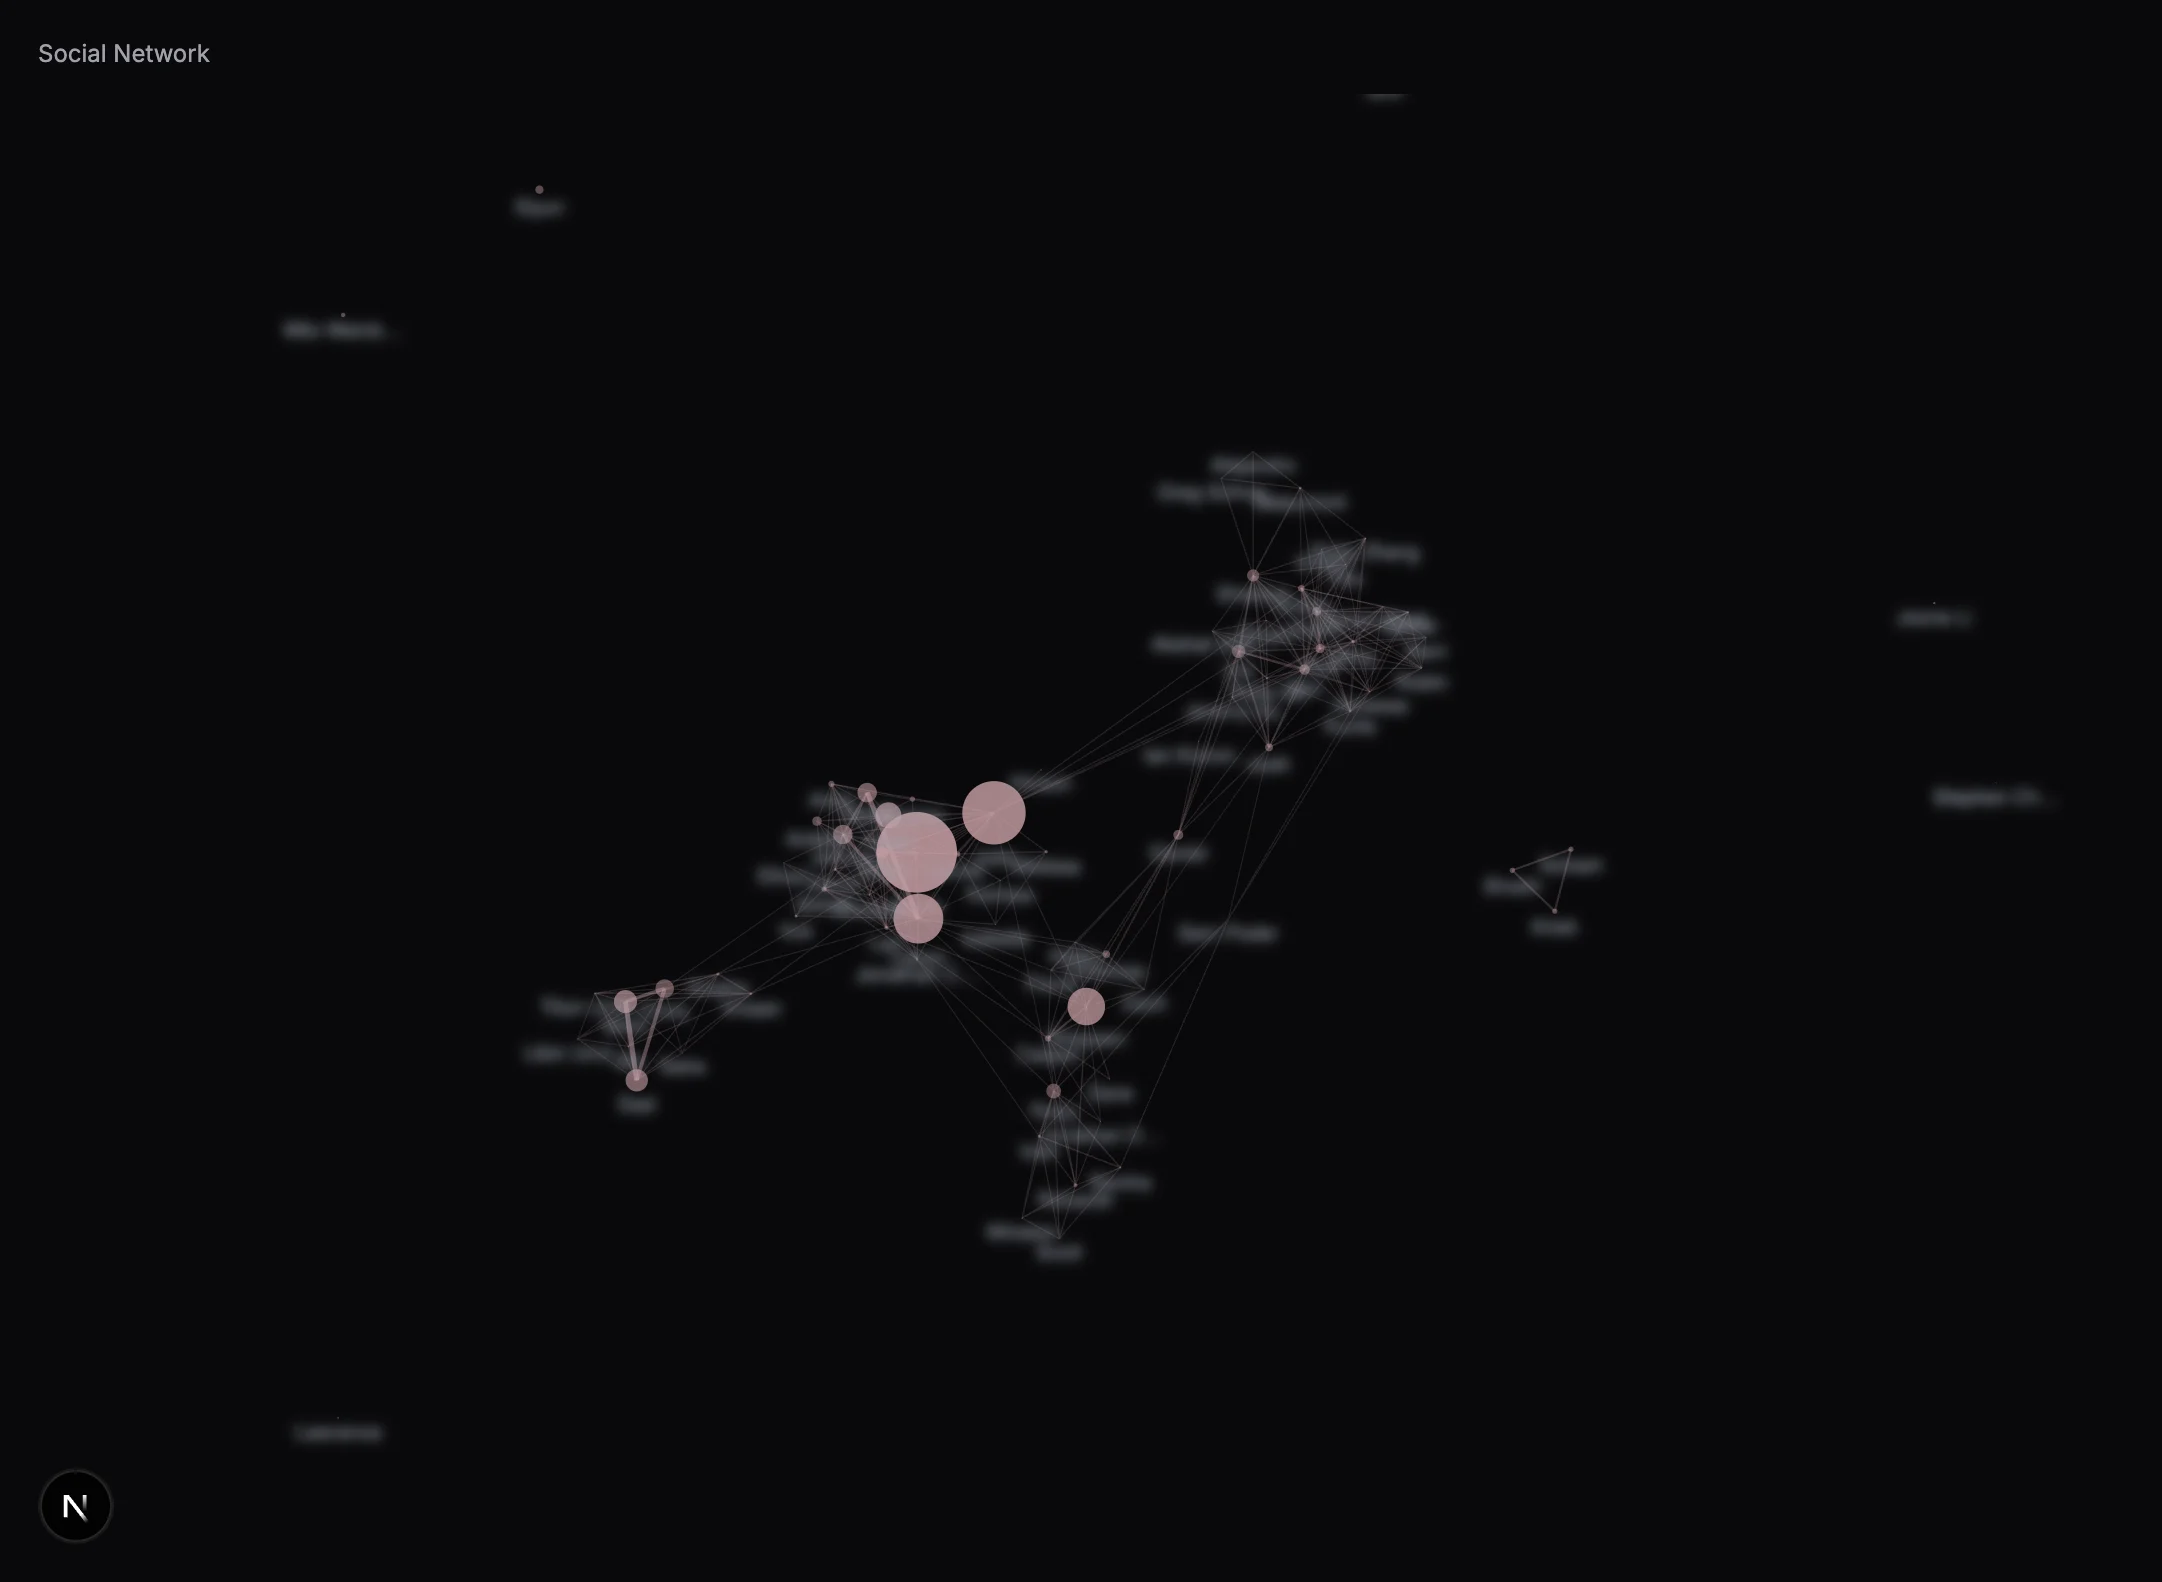
Social
Tracking my time spent with friends was a much later addition to Intellect, and definitely one of the stranger experiences to track. Since I'm not a complete lunatic, I attempt to de-metricize most of these hangouts and primarily use this data to:
- track events on my calendar so I can recall day-to-day and time spent with friends
- build an elaborate graph of how my friends across cities and groups happen to intersect through overlapping hangouts